
Trading journal · live · prop · paper
Find out what's actually costing you money
Tradeblyn reads your closed trades, finds the habits that cost you money, and shows you the working. Then it will talk you through them.
No card required · Full access · Export your data any time
Trade Leaks
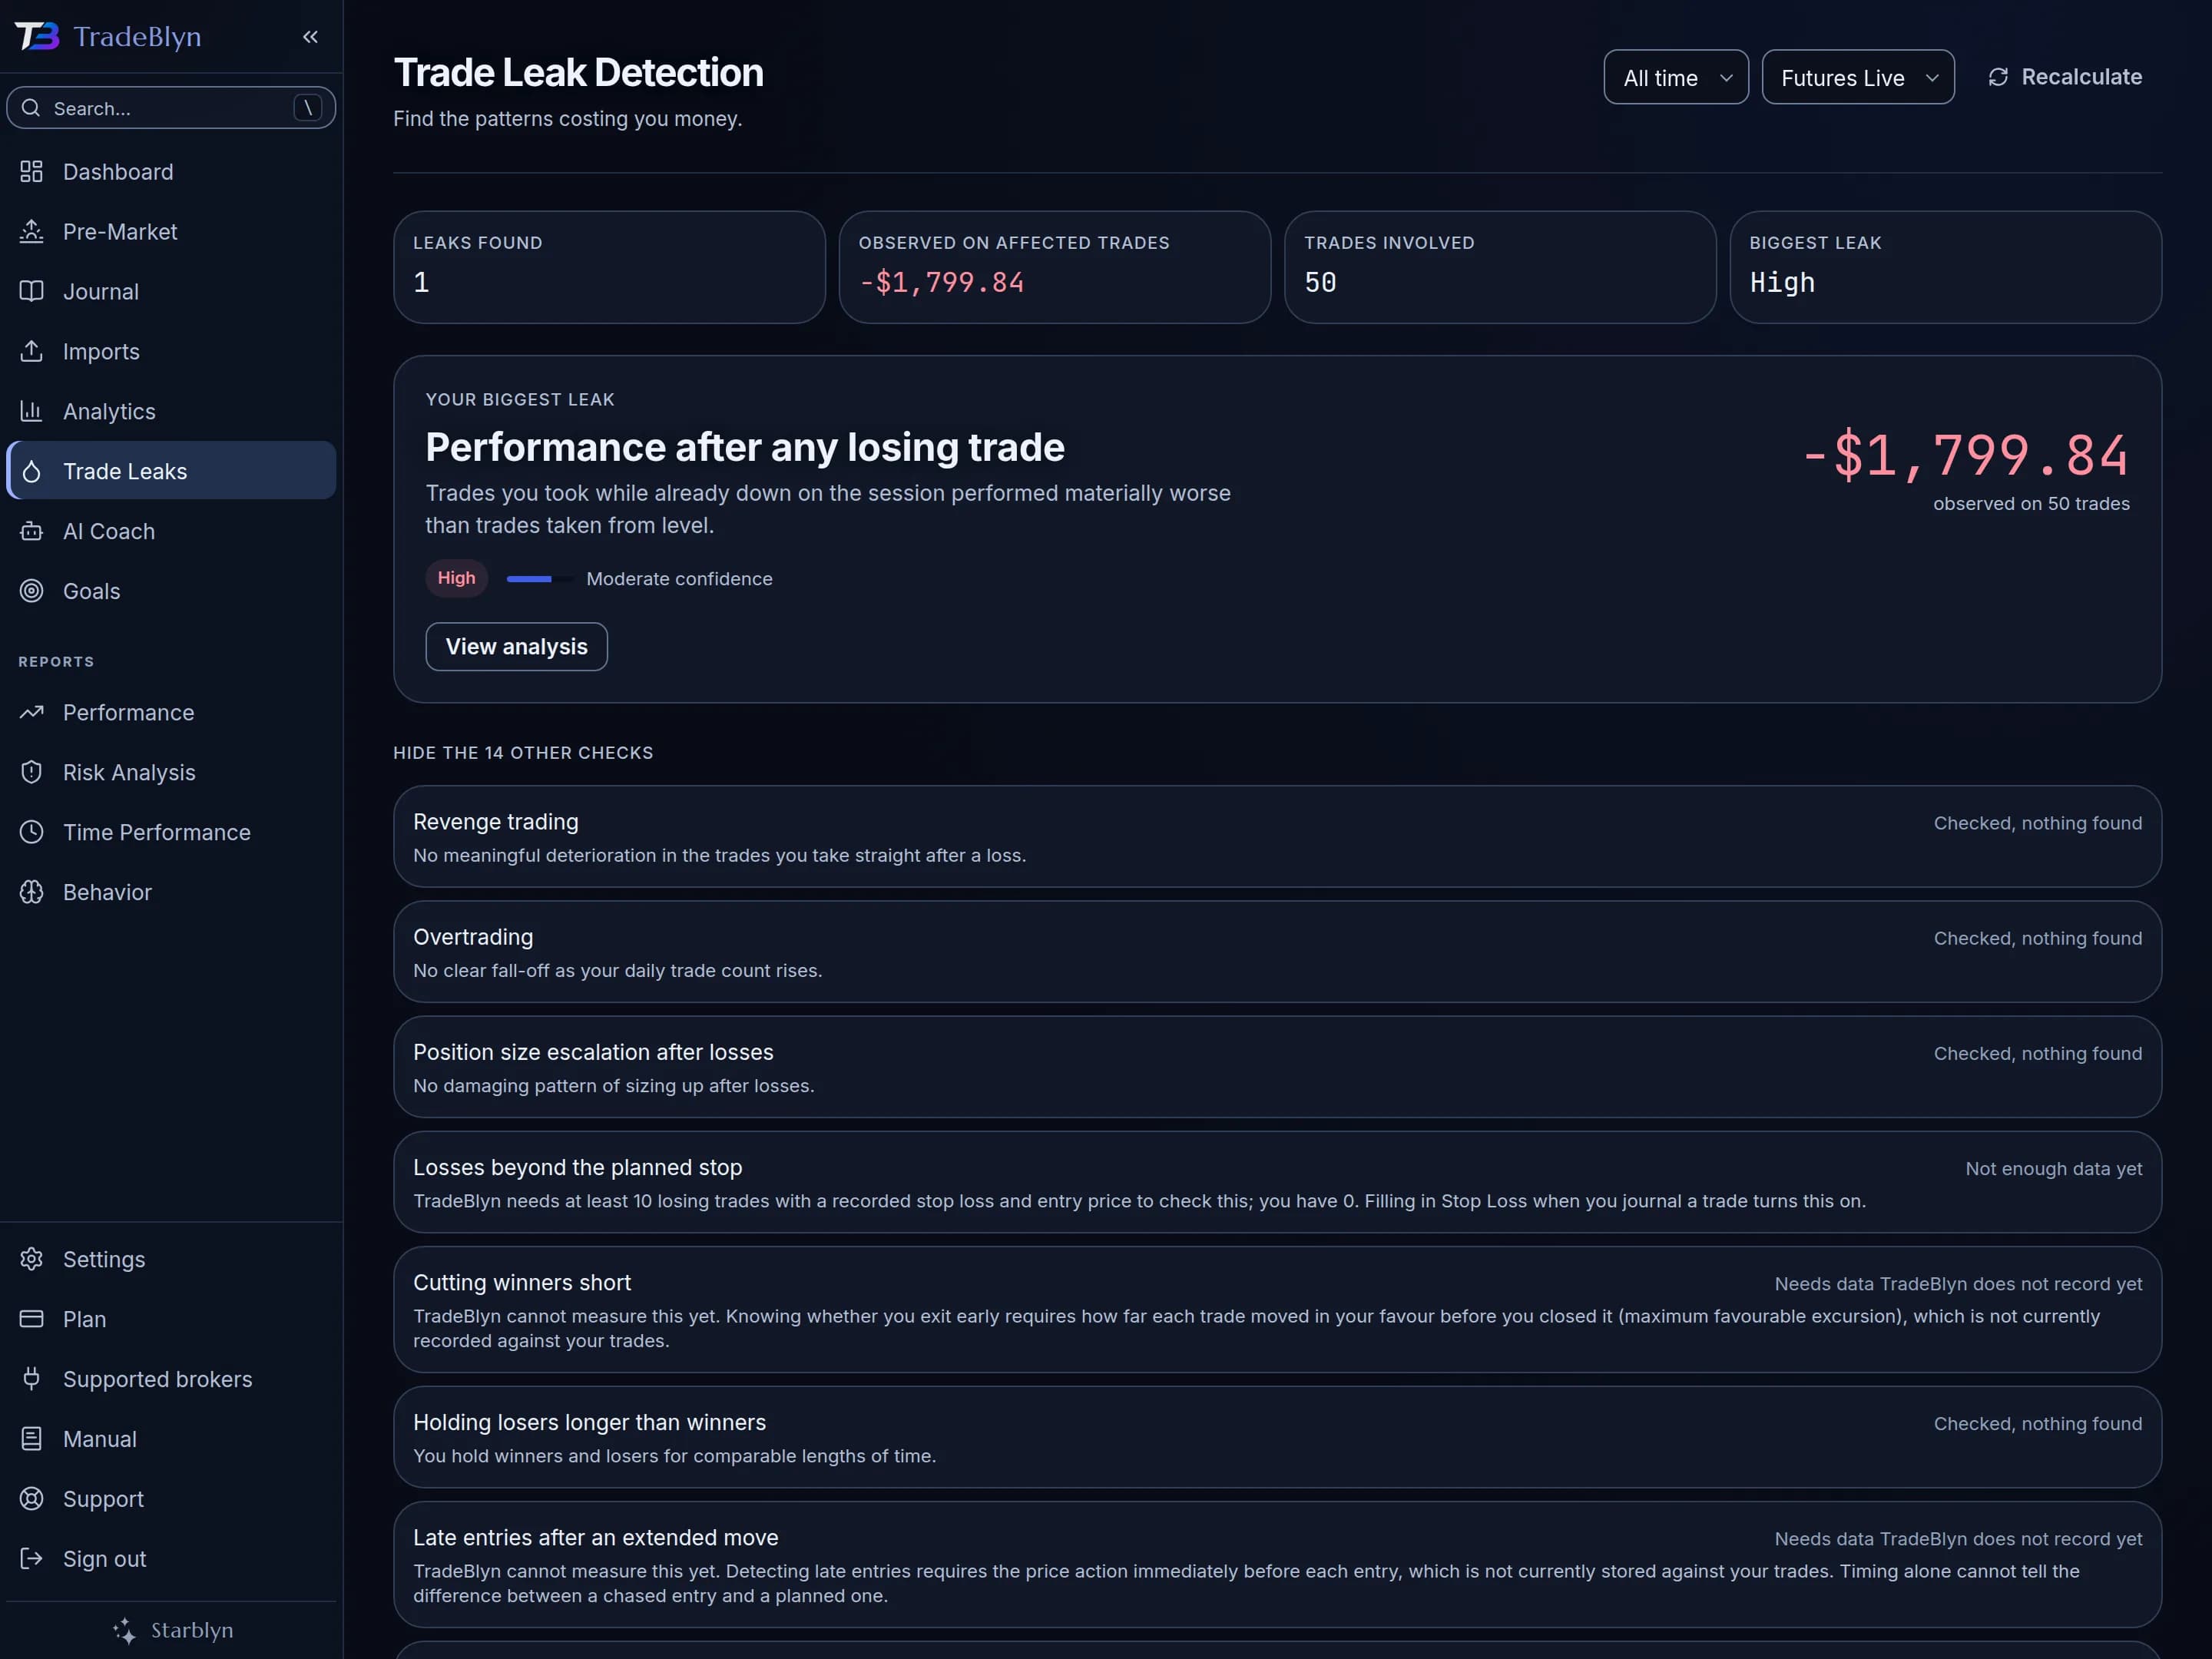
Fifteen checks over your closed trades, looking for the behaviour that repeats and costs. Each finding shows its sample, its baseline and its working.
AI Coach
Ask about your own trading and get an answer from your own numbers. Exact questions never reach a model at all, so the figure cannot be wrong.
Import and cross-tab
Nine broker formats including raw fills. Eighteen dimensions to cross-tab, from session and setup through to sleep and stress.
Imports from
Your analytics show what happened. This shows what it cost.
Fifteen checks run over your closed trades looking for behaviour that repeats and damages your results: trading straight after a loss, sizing up when you are down, staying at the desk past the point your results fall off, holding losers longer than winners, a session or an instrument quietly taking most of your losses.
Every finding opens onto its working: how many trades, what they expected against your own baseline, across how many separate days, and whether the difference is likely to be chance. The trades behind it are one click away as real journal rows.
Two numbers, never mixed up
Observed is a fact: what those trades actually made or lost. Potentially avoidable is an estimate, comparing the same trades against your own baseline over the same period.
They are always shown separately, and the estimate always says it is one. Two checks report no avoidable figure at all, because there is no honest way to calculate one for them.
Not a chatbot with a trading theme
Ask what your biggest leak is, which setup performs best for you, whether you are overtrading, or what changed between your profitable and losing weeks. The Coach reads your closed trades and answers from them.
Exact questions never reach a model
“What is my win rate” is answered straight from your analytics, instantly. It is faster, it costs nothing, and the number cannot be wrong.
It cannot make numbers up
Every figure is checked against your real analytics before you see it. Anything that does not match is thrown away and the answer is rebuilt from your data.
It will not give you a signal
Ask whether to buy something and it will tell you that is not what it does. It has no view on where any price is going and does not pretend to.
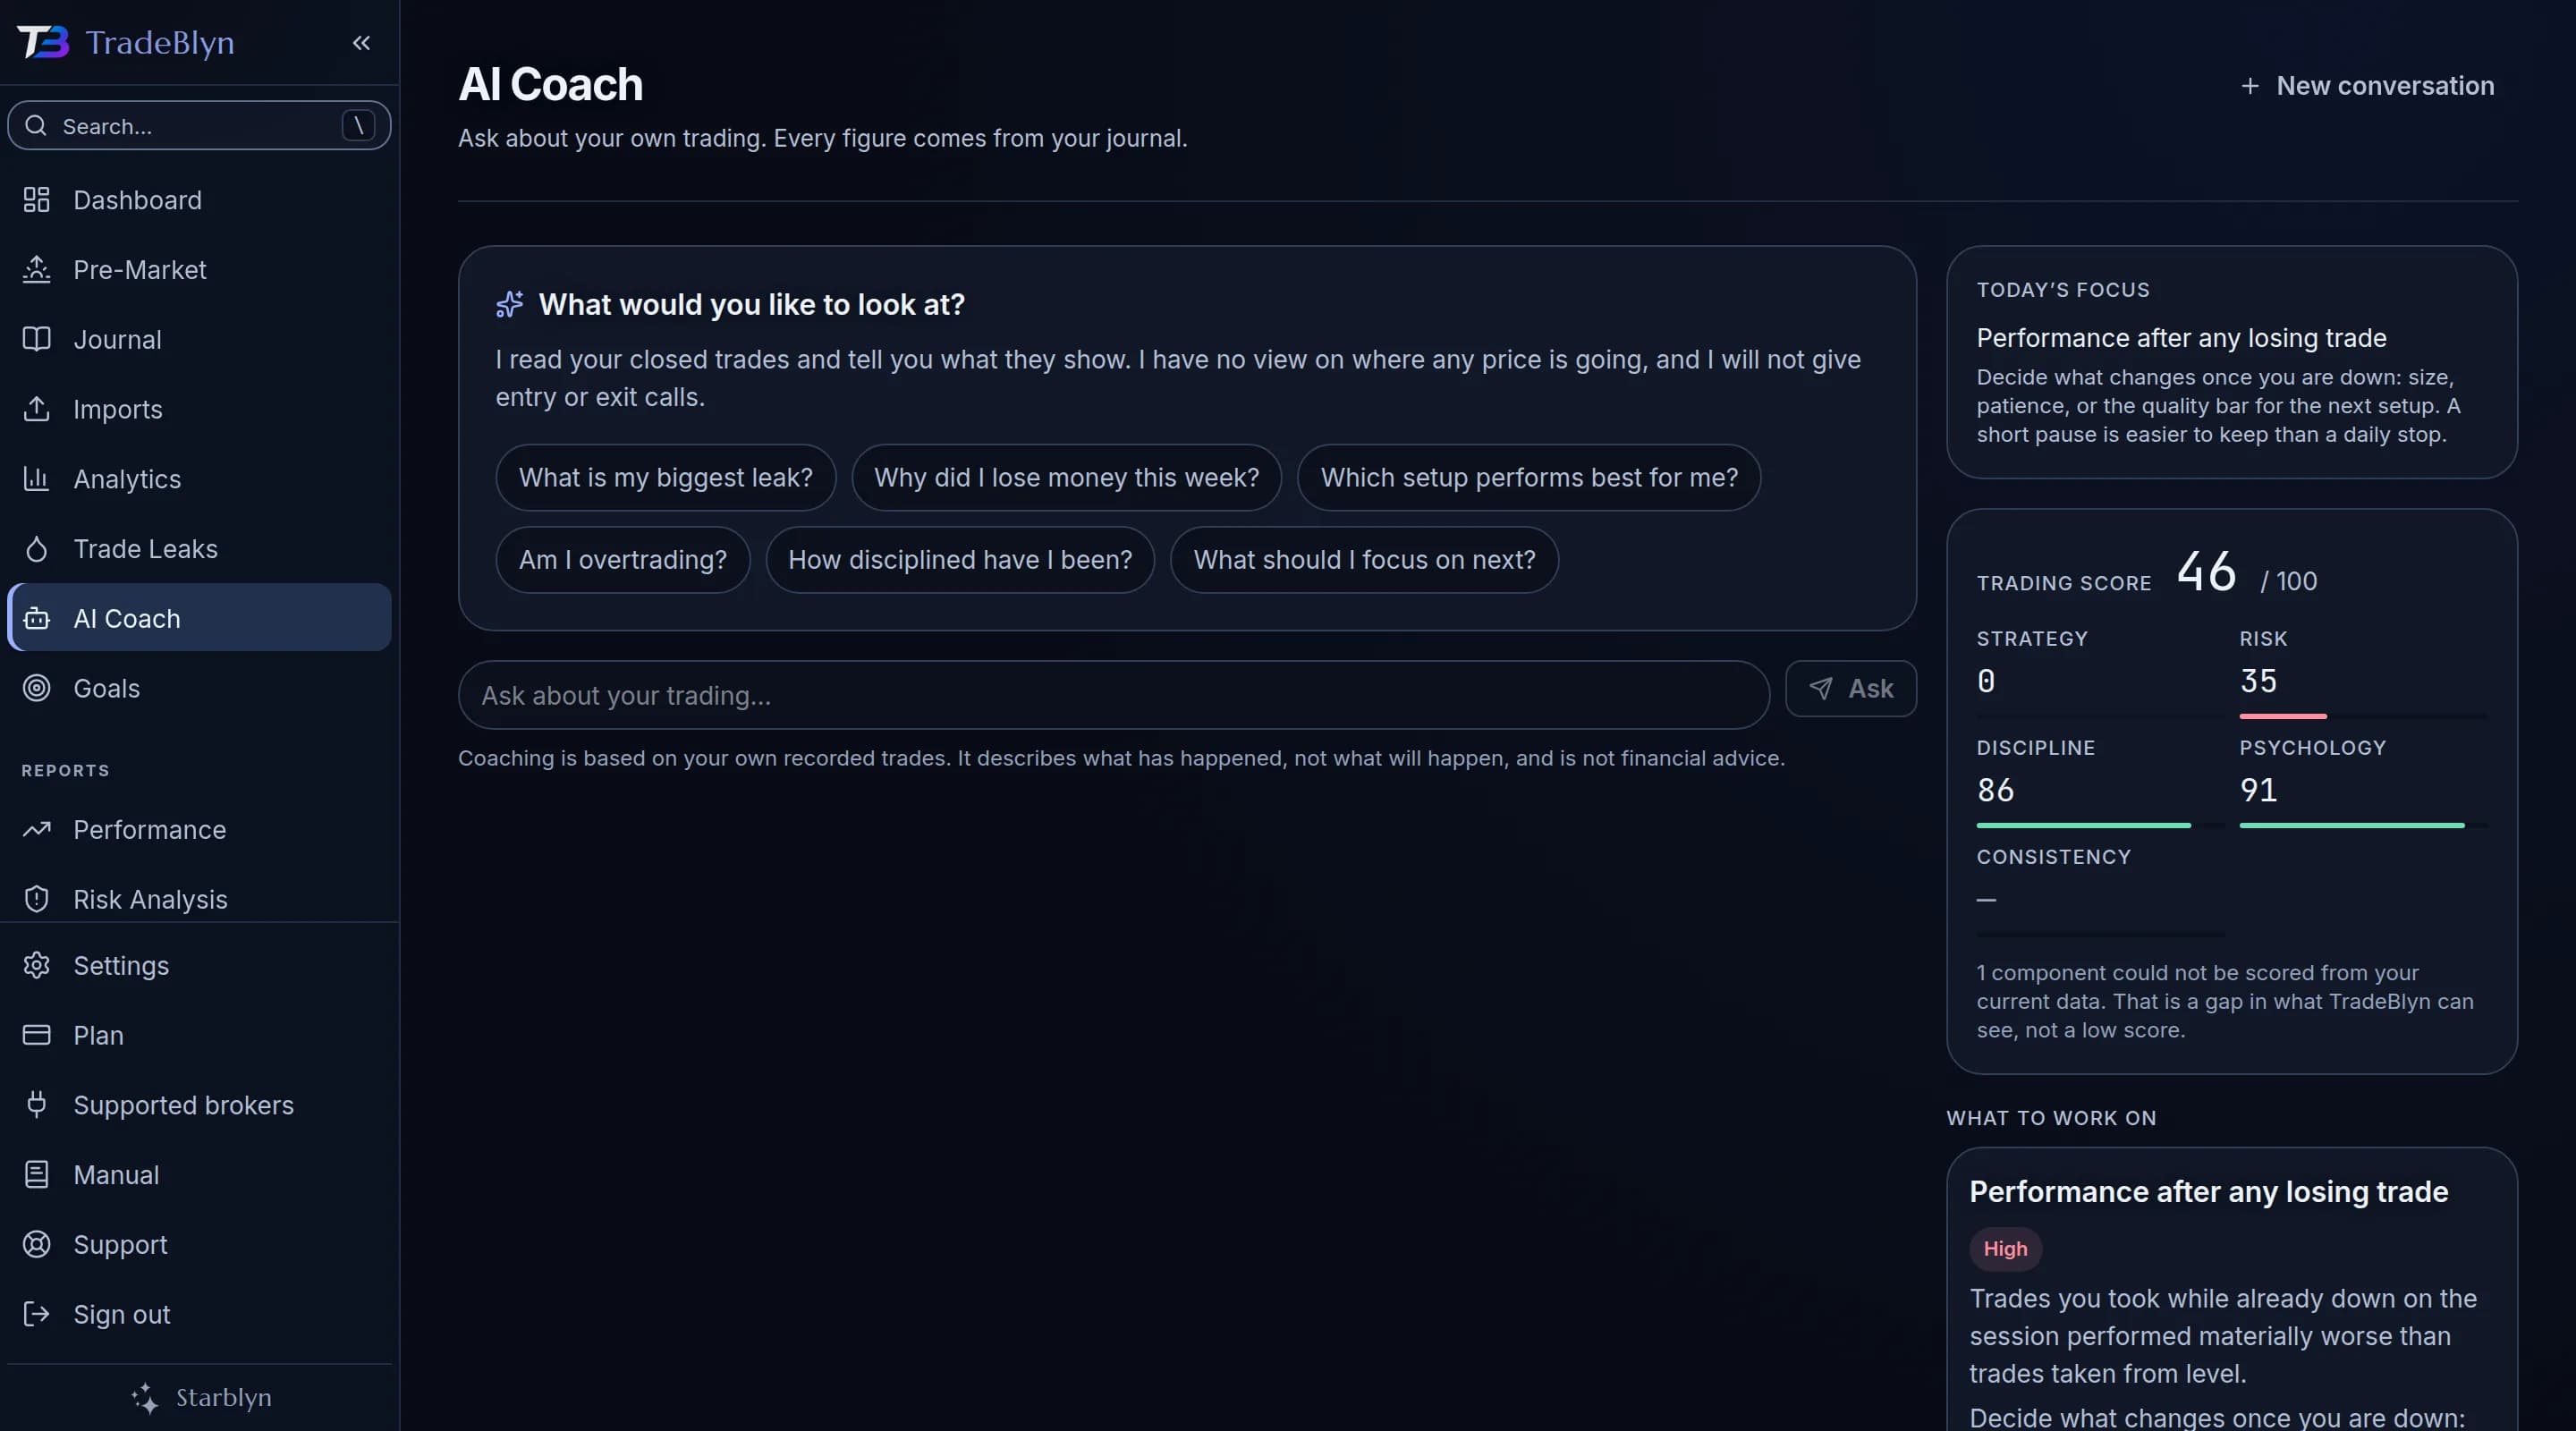
Your Trading Score has five parts, each calculated from your trades rather than assigned by an AI. Anything Tradeblyn cannot measure shows a dash instead of a number. If you have never recorded a stop loss, that is not bad risk management, it is something Tradeblyn cannot see, and scoring it zero would be a lie dressed up as a metric.
It will not tell you Friday is your worst day
Four bad Fridays is not a Friday problem. Most journals will call it one anyway, because a confident finding looks more useful than an honest silence.
Below ten trades, nothing
Not a weak finding, not a hedged one. A check under the threshold reports nothing at all.
Three days before it is a habit
A pattern has to appear on at least three separate days before it is called a habit rather than one bad afternoon.
Confidence capped by evidence
Confidence is limited by how much data sits behind it, so a real but thin pattern is reported quietly instead of loudly.
The report lists every check that came back clean, and why. Two checks are not available yet and say so plainly rather than being quietly missing: spotting whether you cut winners short needs to know how far each trade moved in your favour before you closed it, and Tradeblyn does not record that yet.
Nine broker formats, including raw fills
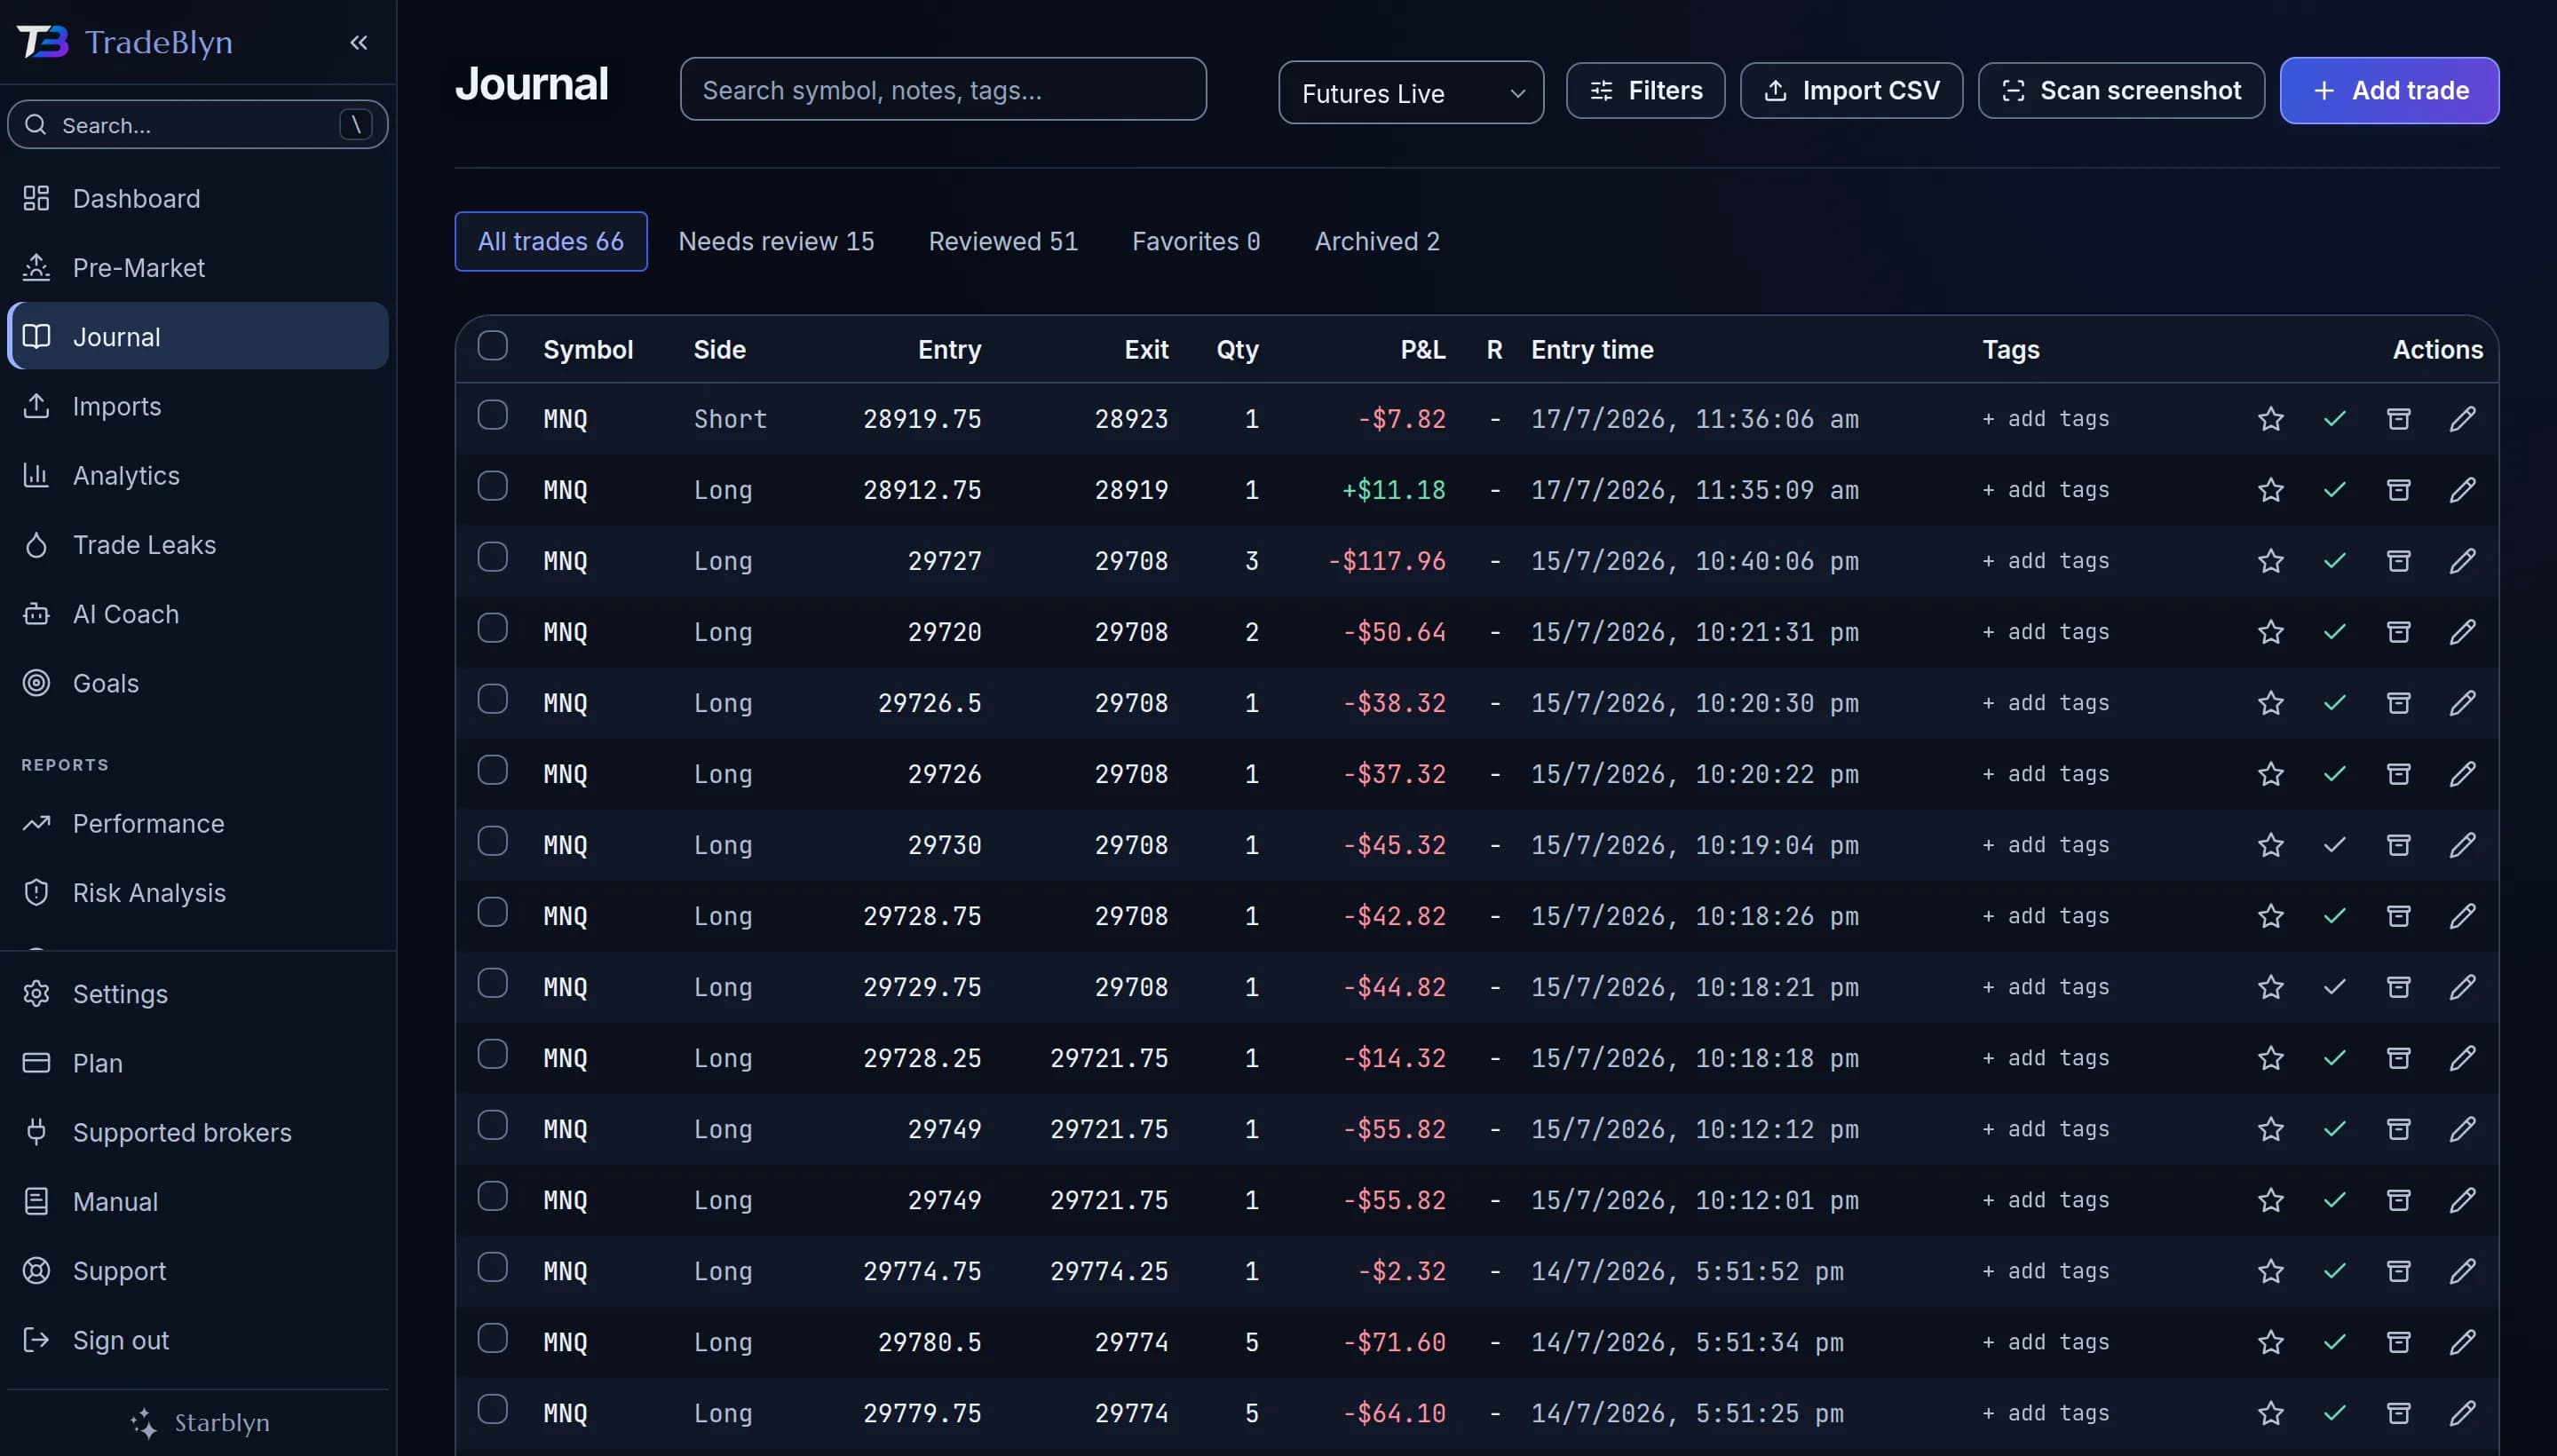
Drop in the export and we identify it. Order-history and fill files are reconstructed into round-trip trades, scale-ins and scale-outs included. Duplicates are skipped, so re-importing an overlapping file will not double-count, and any import can be undone as a batch.
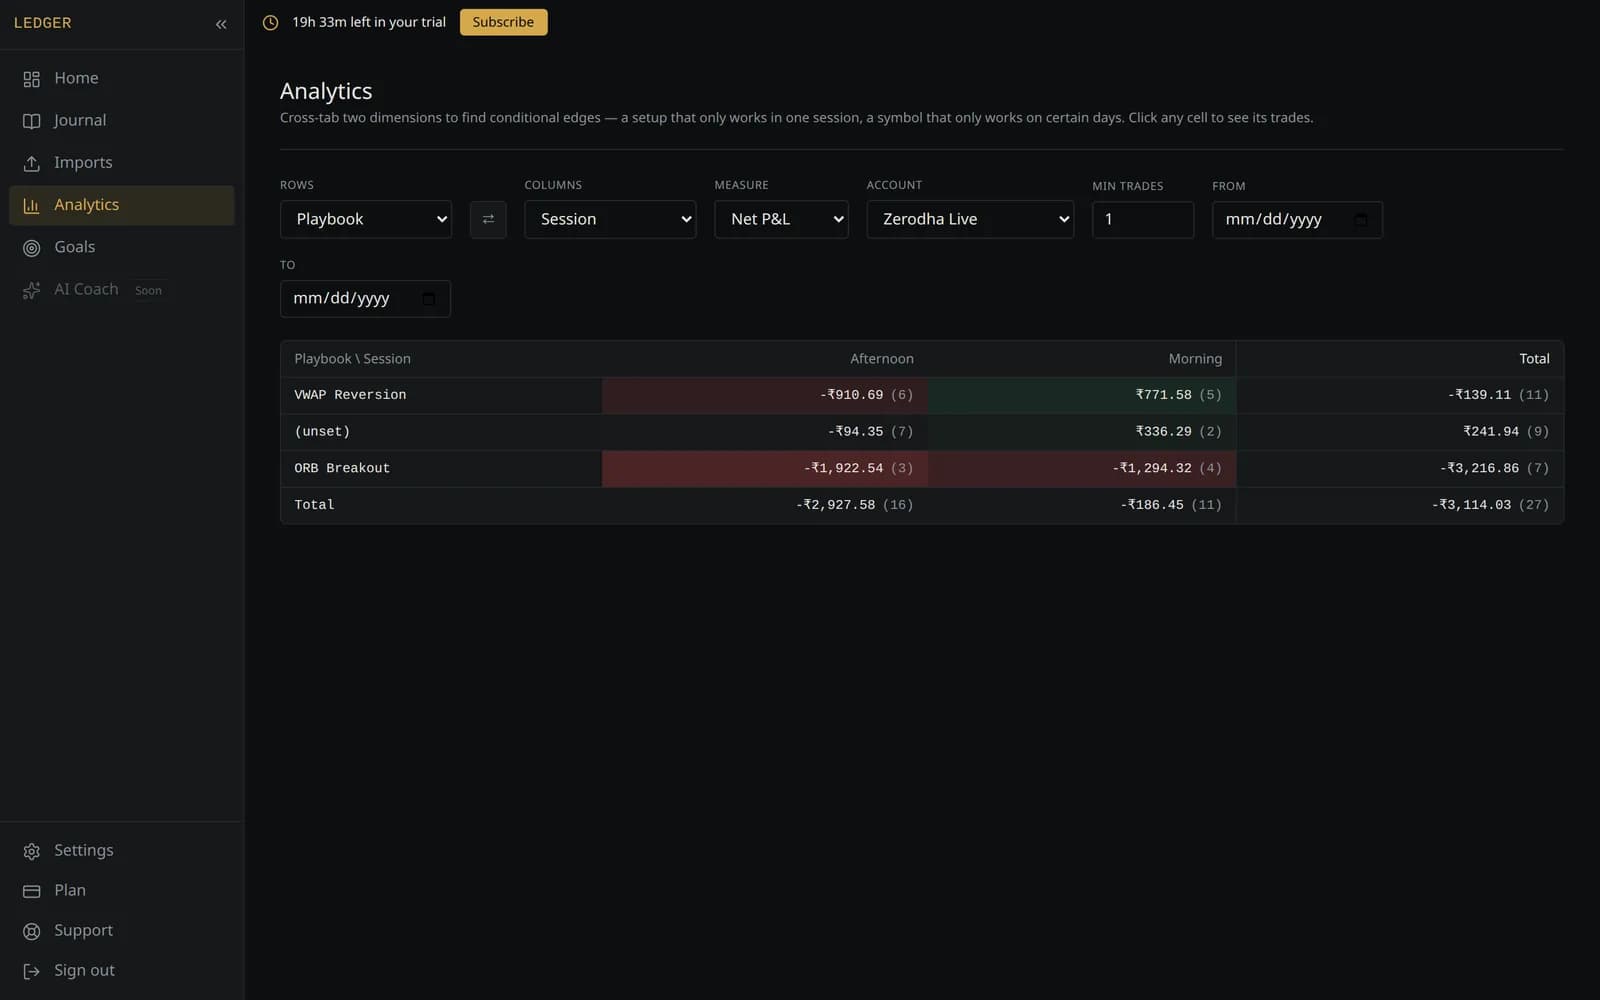
Cross-tab any two things about your trading
Eighteen dimensions: session, setup, playbook, day, duration, emotion, confidence, stress, sleep, mistakes. Pick two, pick a measure, read the answer off the grid. A minimum-trade filter stops you finding a pattern in three trades.
Evaluation rules tracked as you trade
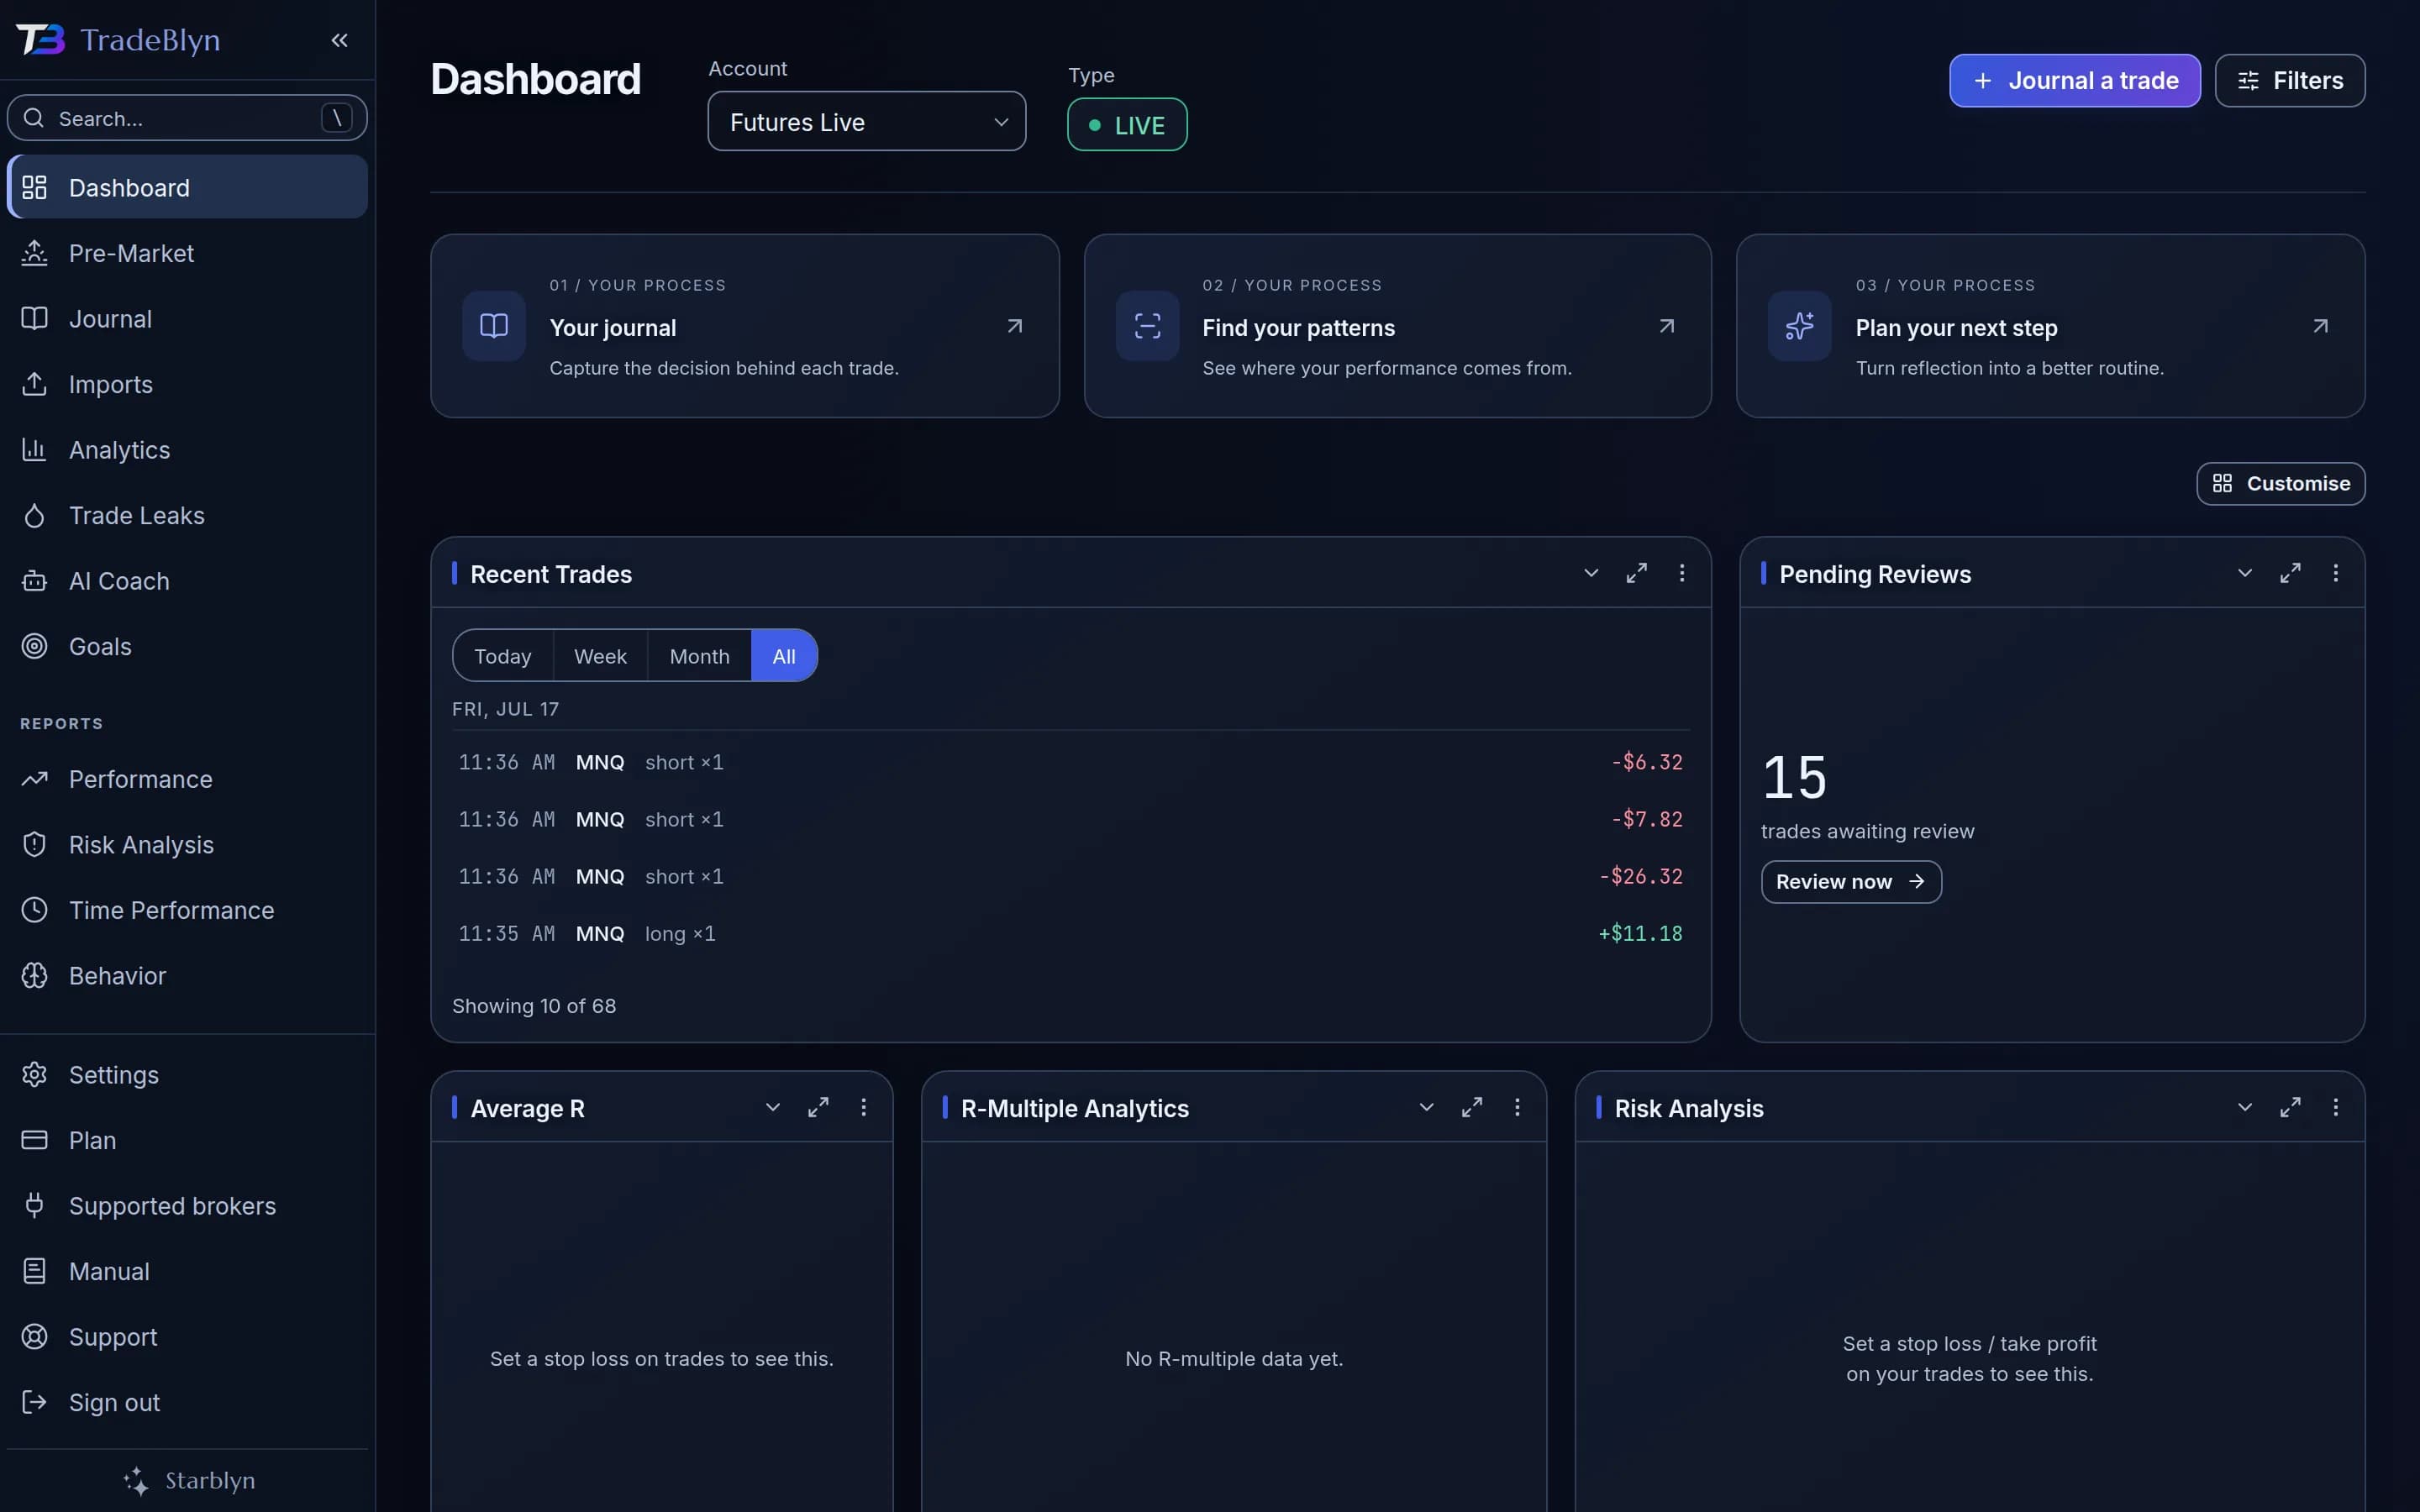
Set your daily loss limit, max drawdown, profit target, minimum trading days and consistency rule. The dashboard reshapes around the account type, so a prop challenge shows rule tracking and a sim account does not pretend to be real money.
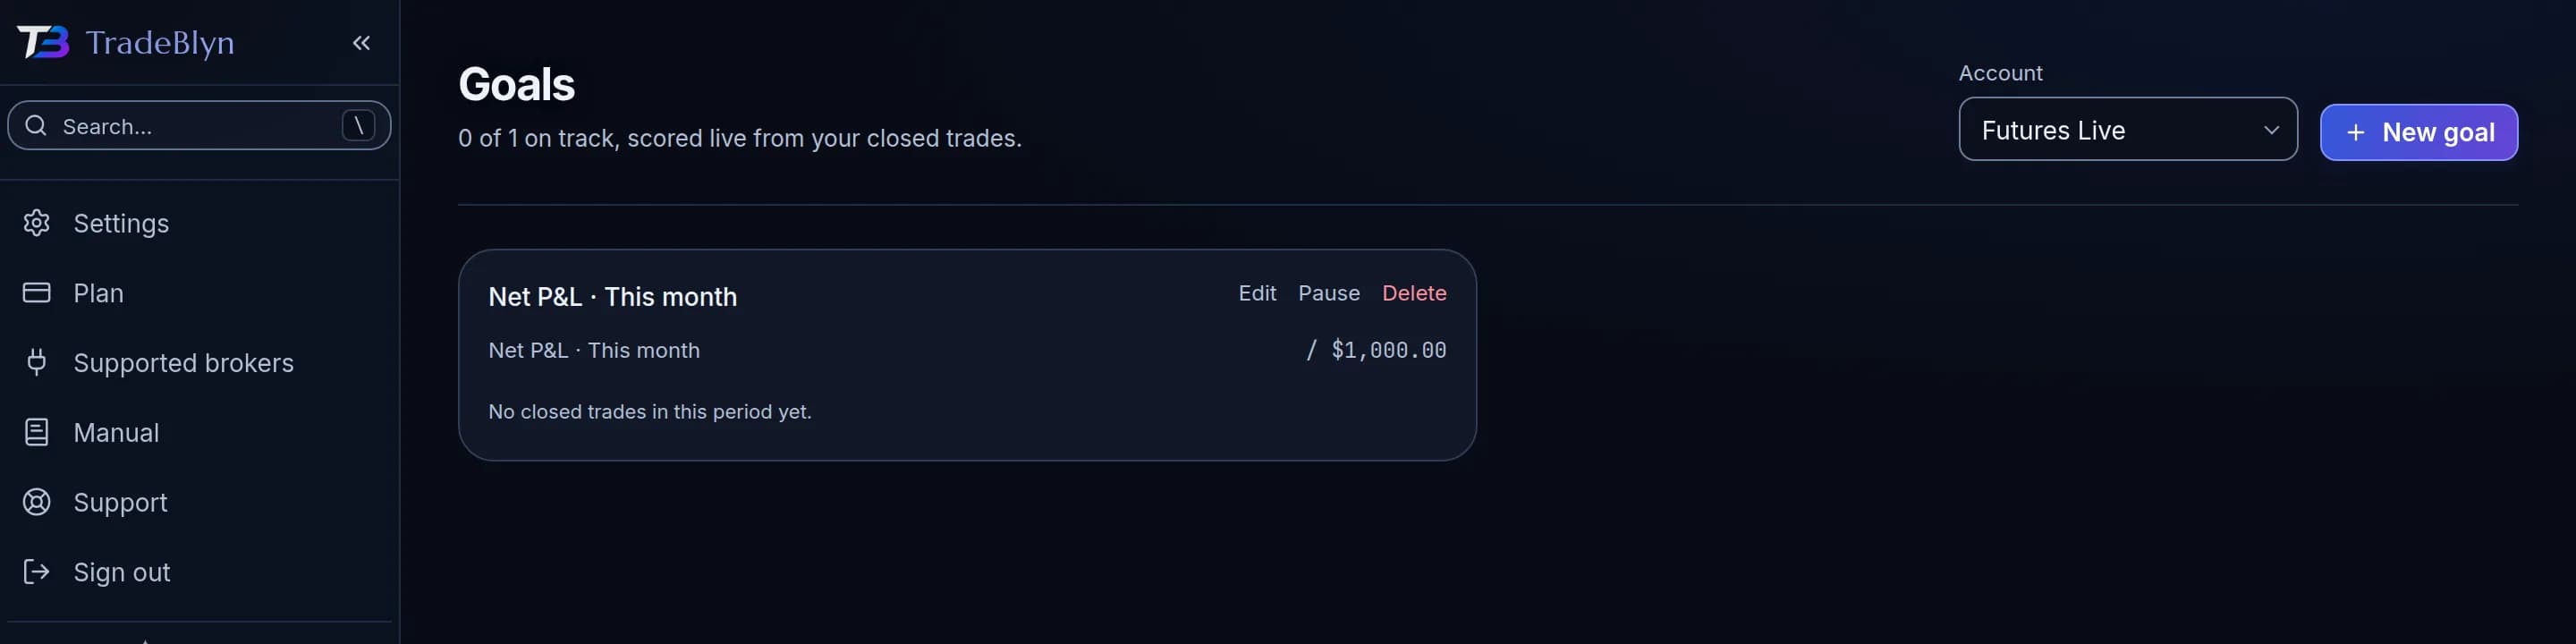
Goals that score themselves
Win rate, profit factor, average R, drawdown caps, set weekly, monthly or all-time and scoped to one account or all of them. Scored from your closed trades, so there is nothing to keep updated by hand.
One plan
7 days free, no card. Then everything, for one price.
- Trade Leak Detection
- AI Coach and Trading Score
- Unlimited trading accounts
- Unlimited trades
- All nine broker importers
- Prop-firm rule tracking
- Cross-tab analytics and goals
- Export your data any time
Your trades stay yours. Export them whenever you want.
Questions
What happens after the 7 days?
The app locks until you subscribe, but nothing is deleted. Your trades are exactly where you left them, and you can export them to CSV at any point, including after the trial ends.
Do I need a card to start?
No. Sign up, verify your email, and you get full access for 7 days. We ask for payment details only if you decide to continue.
How many trades before the leak detection says anything?
Ten in a given check, across at least three separate days. Below that it reports nothing rather than guessing, and the Coach caps its confidence by how much data sits behind each figure. A brand new journal will be quiet for a while, on purpose.
Does the AI see my trades?
The model never sees a raw trade and never calculates a statistic. Analytics compute the figures first, the model only explains them, and every number in an answer is checked against your real analytics before you see it. Without an API key configured the Coach still works, reading your own figures directly.
What if my broker isn't listed?
Any CSV works. If auto-detection cannot identify the file, you map the columns yourself once, symbol here, entry price there, and it imports the same way. Save the mapping and next time is one click. Or send us a sample export and we will add proper support for it: support@starblyn.com
Will it double-count if I re-import?
No. Duplicates are detected and skipped by default, so you can safely re-import an export that overlaps one you already loaded.
Can I track a prop-firm evaluation?
Yes, that is what the prop account type is for. Set your firm's daily loss limit, max drawdown, profit target, minimum trading days and consistency rule, and the dashboard tracks you against them.